|
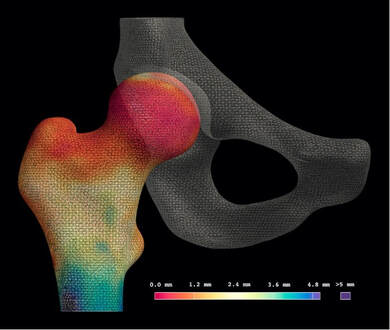
The motivation for developing joint space mapping was the drive to improve on radiographic joint space assessment for more accurate and sensitive detection of osteoarthritis disease progression. We have proposed that the most logical advance from a 2-D planar representation of a joint would be a 3-D model approach, with logic further dictating that computed tomography (CT) could achieve this with x-ray based volumetric imaging of mineralised tissues. The concept of measuring joint space width as the distance between two bony articular surfaces was taken from cortical bone mapping. This imaging analysis technique was initially developed to assess properties such as cortical bone thickness and mineral density in the setting of osteoporosis, and is now well established in its utility for identifying links with fracture risk at the proximal femur[1]. Cortical bone mapping deblurs clinical CT imaging data to measure the thickness of cortical bone to levels of accuracy well below the imaging system resolution capability, presenting measurement data on a topographically realistic 3-D surface (Figure 1). However, rather than just looking at the thickness of cortical bone, the same algorithmic optimisation approach can be used to measure the distance between outer bone surfaces at a joint, hence delivering joint space width.
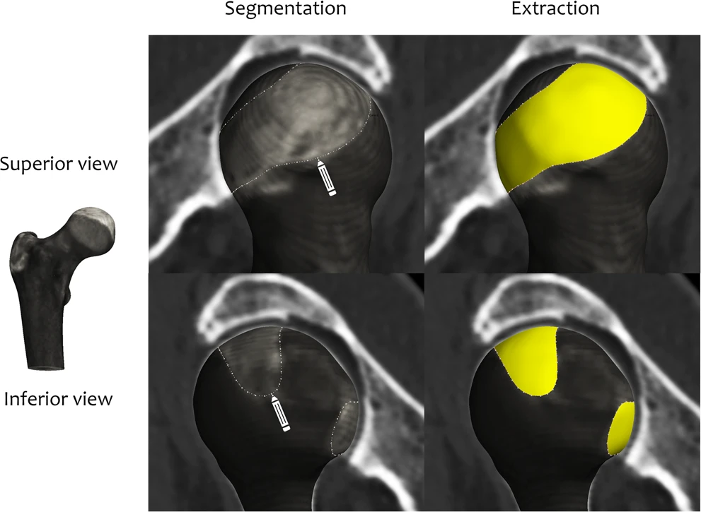
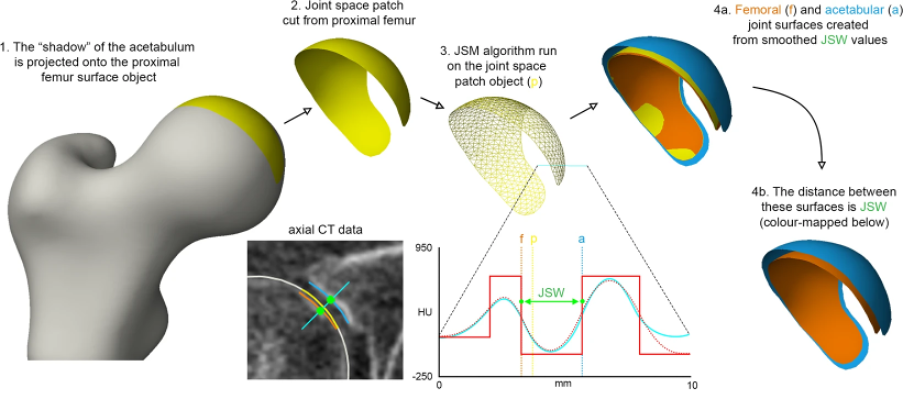
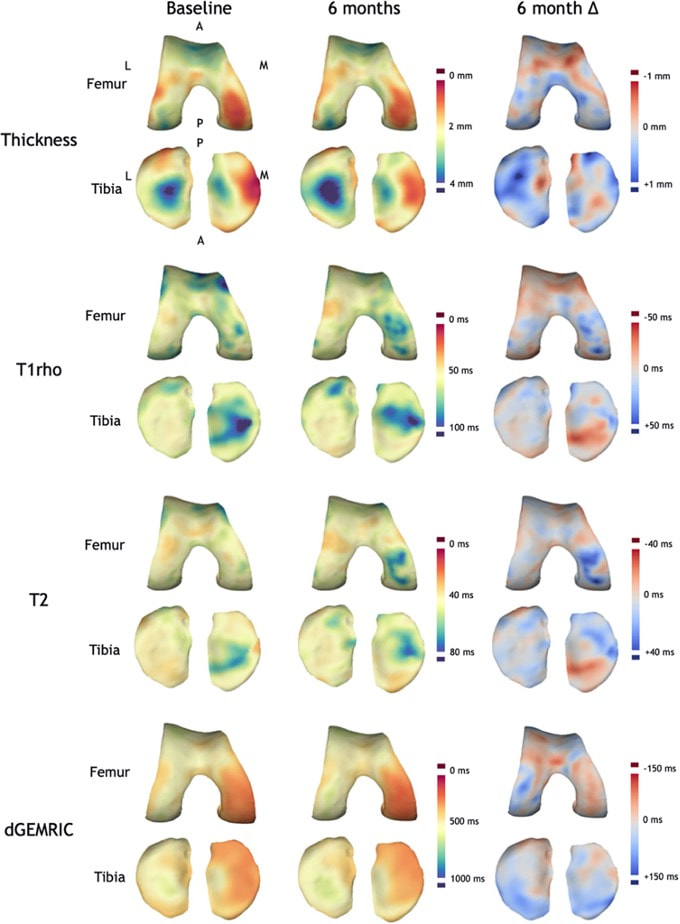
But in order to do this, the margins of the joint space need to be defined. Figure 2 summarises how this is achieved at the hip joint, taking the ‘shadow’ of opposing acetabular bone projected back onto the surface of the femoral head and manually segmenting this out for extraction as the ‘joint space patch’. These steps, along with the joint space measurement algorithm, are performed using the free-to-download software package StradView, developed by Dr Graham Treece and colleagues at the Cambridge University Engineering Department[5]. The joint space patch then acts as a 3-D framework for the joint space mapping algorithm in which the distance between bony surfaces is measured from the imaging data volume and mapped out vertex by vertex (Figure 3). Figure 3 The algorithm for joint space mapping (JSM) at the hip, with joint space width (JSW) defined as the distance between the acetabular (blue) and femoral (orange) articular bone surfaces in 3-D as measured from the original joint space patch (yellow)[6]. Application of joint space mapping at the hip in collaboration with the Icelandic Heart Association and AGES-Reykjavik cohort showed that embracing a 3-D CT-based approach to joint space width assessment (including 3-D morphological parameters and Kellgren & Lawrence grade derived from the same CT imaging) led to an 18% improvement in prediction of future total hip replacement over the FDA gold standard of 2-D minimum JSW measurement[7]. In contrast to these hip studies that used supine imaging, an important technical development over the last decade has been the ability to acquire CT imaging at weight bearing lower limb joints with cone beam technology. The orthopaedic foot and ankle community have been early adopters of this, with joint space mapping having now also been demonstrated at the weight bearing ankle[8]. However, it is only relatively recently that weight bearing CT has been gaining popularity at the knee (see the feature by Neil Segal on this page as an exemplar of this pioneering work). In collaboration with Professor Segal from Kansas, USA, joint space mapping has now also been applied at the knee (Figure 4) to show its reproducibility, test-retest sensitivity, and relationship with radiographic grading[9]. 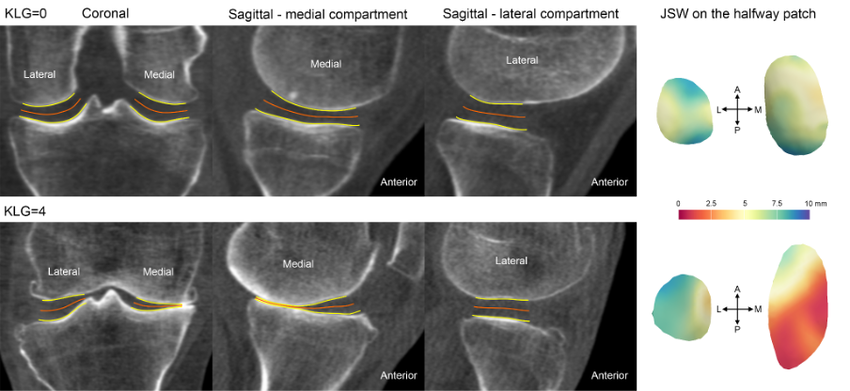 Figure 4 Joint space mapping at the knee using weight bearing cone beam CT technology in two individuals, one with a Kellgren and Lawrence grade (KLG) of 0 (no osteoarthritis) and another with 4 (severe osteoarthritis).The yellow lines represent the bony articular surfaces within the limits of the joint space perimeter, while the orange lines represent the ‘skeleton’ of the joint at the halfway point, on which the colour wash joint space maps are displayed. The main perceived advantage of a 3-D joint space mapping approach over radiographic joint space measurement is the potential for greater sensitivity in phenotyping and detecting structural disease progression. However the concurrent and predictive validity of this does now need to be tested in a cohort with relevant clinical outcome measures, as is underway in collaboration with the Multicenter Osteoarthritis Study[10]. In addition, joint space maps from the same (or different) individuals can be easily compared by registration to a ‘canonical’ surface, which can then not only be used to look at differences between time points and study groups, but also to perform relevant statistical analysis with statistical parametric mapping. This registration process is performed using free-to-download software developed by Dr. Andrew Gee at the Cambridge University Engineering Department[11]. Statistical parametric mapping can be performed using the SurfStat toolbox for MATLAB[12]. The robustness and versatility of a 3-D surface-based approach to assessment of structural joint disease has also been translated to magnetic resonance imaging (MRI). Cartilage surface mapping, recently developed and tested by MacKay and colleagues from Cambridge and Norwich, UK, has delivered a platform for multiparametric analysis of MRI data at the knee in prize-winning research recognised by the International Society of Magnetic Resonance Medicine (Figure 5)[13]. Figure 5 Baseline and 6-month follow-up thickness and relaxation time data for a single OA participant displayed on canonical femoral and tibial surfaces (dGEMRIC = delayed gadolinium enhanced MRI of cartilage). Note the spatial heterogeneity of changes and the co-occurrence of both significant positive and negative changes in thickness and T1rho/T2 relaxation times[14]. If you are interested in finding out more or using any of these 3-D imaging analysis techniques, then please contact Dr. Turmezei through his OCTA profile page[15]. Dr. Tom Turmezei
Consultant Radiologist, Norfolk and Norwich University Hospital, UK Honorary Associate Professor, University of East Anglia, UK Twitter handles: @3DJointSpace | @tomturmezei
0 Comments
Leave a Reply. |
Archives
May 2024
Categories
|
 RSS Feed