|
Osteoarthritis and CartilageVolume 32, Issue 3, March 2024, Pages 299-309
Jiri Jäntti, Anisha Joenathan, Maria Fugazzola, Juuso Tuppurainen, Juuso T.J. Honkanen, Juha Töyräs, René van Weeren, Brian D. Snyder, Mark W. Grinstaff, Hanna Matikka, Janne T.A. Mäkelä Objective: Cationic tantalum oxide nanoparticles (Ta2O5-cNPs), as a newly introduced contrast agent for computed tomography of cartilage, offer quantitative evaluation of proteoglycan (PG) content and biomechanical properties. However, knowledge on the depth-wise impact of cartilage constituents on nanoparticle diffusion, particularly the influence of the collagen network, is lacking. In this study, we aim to establish the depth-dependent relationship between Ta2O5-cNP diffusion and cartilage constituents (PG content, collagen content and network architecture). Methods: Osteochondral samples (n = 30) were harvested from healthy equine stifle joints (N = 15) and the diffusion of 2.55 nm diameter cationic Ta2O5-cNPs into the cartilage was followed with micro computed tomography (µCT) imaging for up to 96 hours. The diffusion-related parameters, Ta2O5-cNP maximum partition (Pmax) and diffusion time constant, were compared against biomechanical and depth-wise structural properties. Biomechanics were assessed using stress-relaxation and sinusoidal loading protocols, whereas PG content, collagen content and collagen network architecture were determined using digital densitometry, Fourier-transform infrared spectroscopy and polarized light microscopy, respectively. Results: The Pmax correlates with the depth-wise distribution of PGs (bulk Spearman’s ρ = 0.87, p < 0.001). More open collagen network architecture at the superficial zone enhances intake of Ta2O5-cNPs, but collagen content overall decreases the intake. The Pmax values correlate with the equilibrium modulus (ρ = 0.80, p < 0.001) of articular cartilage. Conclusion: This study establishes the feasibility of Ta2O5-cNPs for the precise and comprehensive identification of biomechanical and structural changes in articular cartilage via contrast-enhanced µCT.
0 Comments
Dual-contrast photon-counting detector computed tomography enables quantitative assessment of articular cartilage
Satu I. Inkinen1,2 and Petri Paakkari3,4
1Research Unit of Medical Imaging, Physics and Technology, University of Oulu, Oulu, Finland 2Helsinki University Hospital, Diagnostic Center, Helsinki, Finland 3Department of Applied Physics, University of Eastern Finlan0064, Kuopio, Finland 4Diagnostic Imaging Center, Kuopio University Hospital, Kuopio, Finland
Highlights - Photon-counting detector computed tomography (PCD-CT) enables multi-energy imaging in a single scan acquisition - Multi-energy CT imaging can be used for quantitative assessment of contrast agent concentrations in tissues - Dual-contrast enhanced imaging of articular cartilage can be used for the assessment/evaluation of tissue composition and structural integrity
Contrast-enhanced computed tomography imaging of articular cartilage
Articular cartilage tissue composition and structural integrity can be investigated using contrast-enhanced computed tomography (CECT) [1], [2]. Especially, the early detection of post-traumatic osteoarthritic changes, such as collagen fibrillation, increase in tissue water content, and proteoglycan loss, are of interest in CECT, as imaging of the early changes are very challenging. Contrast agents (e.g., iodine and gadolinium) attenuate X-rays, and when contrast agents diffuse in articular cartilage, the tissue contrast is improved [3]. Also, the material properties of the contrast agents can be modified to cationic, anionic, or non-ionic which affects the diffusivity in cartilage. For example, a cationic contrast agent is sensitive to proteoglycan content at diffusion equilibrium [4]and it can be applied for differentiation between reparative, degenerative, and healthy articular cartilage [5].
In addition, it is possible to administer several different contrast agents targeting a more comprehensive assessment of tissue composition [6]–[8]. The quantification of several contrast agents requires spectral information which can be conventionally acquired using dual-energy CT (DECT) imaging performed, e.g., using kVp switching during acquisition or dual acquisition with different kVp and filter settings.
Photon-counting detector computed tomography (PCD-CT)
PCD-CT enables spectral imaging in a single acquisition since photon-counting detectors (PCDs) count the individual incoming photons and assign them to energy bins based on photon energy [9], [10]. PCDs can have several bin counters (usually varies between two to six bins), and thus, more energy bin thresholds can be set to detect different photon energies. PCDs are usually Cadmium-Telluride (CdTe) or Cadmium-Zinc-Telluride (CZT) semiconductor detectors that operate through direct conversion. Therefore, PCDs have better detection efficiency enabling radiation dose reductions compared to conventional energy integrating detectors (EIDs) which use indirect conversion (scintillation). Furthermore, PCD has a pixelated anode which enables smaller pixels (e.g., 50x50 µm2) than in EIDs, and thus PCD-CT can provide ultra-high-resolution images which are extremely useful for musculoskeletal applications [11], [12]. First FDA clearance for a clinical PCD-CT device was gained at the end of September 2021 [13].
PCD-CT and CECT imaging of articular cartilage
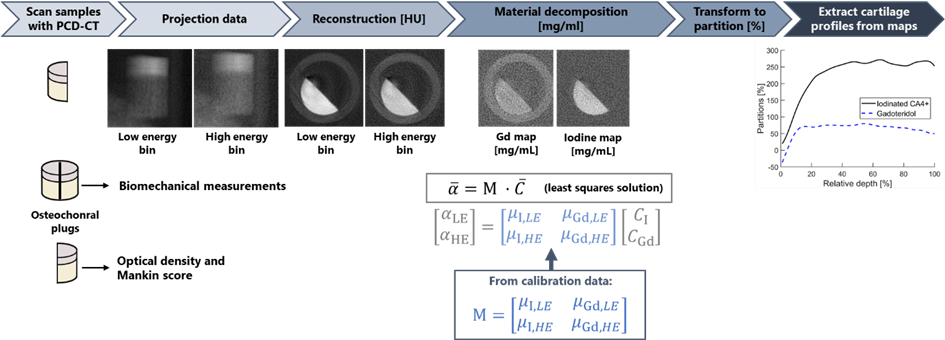
There exist only a few studies on contrast-enhanced PCD-CT imaging of articular cartilage [14], [15]. In our recent study, a dual-contrast agent method using a cationic iodinated CA4+ and non-ionic gadolinium-based gadoteridol was applied in human osteochondral tissue imaging (N=53) with PCD-CT [15]. The PCD-CT scanning was performed in diffusion equilibrium. The cationic iodinated CA4+ targets the proteoglycan distribution and the non-ionic gadolinium-based gadoteridol reflects the tissue water content. The obtained concentration partitions were compared against biomechanical and optical density measurements, and Mankin scoring. The PCD had two-bin counters enabling spectral imaging, and the material decomposition utilized a calibration-based approach to estimate iodine and gadolinium concentrations (Figure 1) [7], [15]. Figure 1. Workflow for assessing the iodine and gadolinium partitions (i.e., measured contrast agent concentration normalized to initial contrast agent bath concentration) using a reconstruction domain material decomposition. First, the raw projection data is collected in two energy bins (Total energy [30-120] keV and High energy [60-120] keV) by the PCD (data not shown). Subsequently, projection data is corrected using the signal-to-thickness calibration method [16], and then low and high bin projection data is reconstructed. After reconstruction, the material decomposition is performed by assessing least-the squares solution for each voxel utilizing the material matrix (M) determined based on attenuation vs. concentration slope of calibration solutions of different concentrations of iodinated CA4+ and gadoteridol.
To summarize, PCD-CT enabled simultaneous quantification of the two contrast agent concentrations inside articular cartilage (Figure 1). The iodine CA4+ concentrations correlated strongly with the proteoglycan content (ρ = 0.836, p < 0.001, Spearman’s correlation), moderately with Mankin score (ρ = -0.307, p < 0.05) and equilibrium modulus (ρ = 0.328, p < 0.05) [15].
In conclusion, PCD-CT enables spectral imaging with improved detection efficiency and higher resolution compared to conventional CT. With this improved soft-tissue contrast and resolution, combined with the comprehensive assessment of proteoglycan and water content via dual-contrast imaging, PCD-CT holds promise for the detection of post-traumatic osteoarthritis in the future. References [1] P. N. Bansal, N. S. Joshi, V. Entezari, M. W. Grinstaff, and B. D. Snyder, “Contrast Enhanced Computed Tomography can predict the glycosaminoglycan content and biomechanical properties of articular cartilage,” Osteoarthr. Cartil., vol. 18, no. 2, pp. 184–191, Feb. 2010, doi: 10.1016/j.joca.2009.09.003. [2] R. C. Stewart et al., “Contrast-Enhanced Computed Tomography Enables Quantitative Evaluation of Tissue Properties at Intrajoint Regions in Cadaveric Knee Cartilage,” Cartilage, vol. 8, no. 4, pp. 391–399, Oct. 2017, doi: 10.1177/1947603516665443. [3] H. Lusic and M. W. Grinstaff, “X-ray-Computed Tomography Contrast Agents,” Chem. Rev., vol. 113, no. 3, pp. 1641–1666, Mar. 2013, doi: 10.1021/cr200358s. [4] P. N. Bansal et al., “Cationic contrast agents improve quantification of glycosaminoglycan (GAG) content by contrast enhanced CT imaging of cartilage,” J. Orthop. Res., vol. 29, no. 5, pp. 704–709, May 2011, doi: 10.1002/jor.21312. [5] B. B. Nelson et al., “Cationic contrast‐enhanced computed tomography distinguishes between reparative, degenerative, and healthy equine articular cartilage,” J. Orthop. Res., vol. 39, no. 8, pp. 1647–1657, Aug. 2021, doi: 10.1002/jor.24894. [6] M. K. M. Honkanen et al., “Triple Contrast CT Method Enables Simultaneous Evaluation of Articular Cartilage Composition and Segmentation,” Ann. Biomed. Eng., vol. 48, no. 2, pp. 556–567, Feb. 2020, doi: 10.1007/s10439-019-02362-6. [7] A. Bhattarai et al., “Quantitative Dual Contrast CT Technique for Evaluation of Articular Cartilage Properties,” Ann. Biomed. Eng., vol. 46, no. 7, pp. 1–9, Apr. 2018, doi: 10.1007/s10439-018-2013-y. [8] A. E. A. Saukko et al., “Simultaneous Quantitation of Cationic and Non-ionic Contrast Agents in Articular Cartilage Using Synchrotron MicroCT Imaging.,” Sci. Rep., vol. 9, no. 1, p. 7118, May 2019, doi: 10.1038/s41598-019-43276-6. [9] C. H. McCollough et al., “Achieving routine submillisievert CT scanning: report from the summit on management of radiation dose in CT.,” Radiology, vol. 264, no. 2, pp. 567–80, Aug. 2012, doi: 10.1148/radiol.12112265. [10] K. Taguchi and J. S. Iwanczyk, “Vision 20/20: Single photon counting x-ray detectors in medical imaging.,” Med. Phys., vol. 40, no. 10, p. 100901, Oct. 2013, doi: 10.1118/1.4820371. [11] W. Zhou et al., “Comparison of a Photon-Counting-Detector CT with an Energy-Integrating-Detector CT for Temporal Bone Imaging: A Cadaveric Study,” Am. J. Neuroradiol., vol. 39, no. 9, pp. 1733–1738, Sep. 2018, doi: 10.3174/ajnr.A5768. [12] F. S. L. Thomsen, S. Horstmeier, J. H. Niehoff, J. A. Peña, and J. Borggrefe, “Effective Spatial Resolution of Photon Counting CT for Imaging of Trabecular Structures is Superior to Conventional Clinical CT and Similar to High Resolution Peripheral CT,” Invest. Radiol., vol. Publish Ah, Mar. 2022, doi: 10.1097/RLI.0000000000000873. [13] “FDA Clears First Major Imaging Device Advancement for Computed Tomography in Nearly a Decade,” FDA NEWS RELEASE. https://www.fda.gov/news-events/press-announcements/fda-clears-first-major-imaging-device-advancement-computed-tomography-nearly-decade. [14] K. Rajendran et al., “Quantitative Knee Arthrography in a Large Animal Model of Osteoarthritis Using Photon-Counting Detector CT,” Invest. Radiol., vol. 00, no. 00, p. 1, Jan. 2020, doi: 10.1097/RLI.0000000000000648. [15] P. Paakkari et al., “Quantitative dual contrast photon-counting computed tomography for assessment of articular cartilage health,” Sci. Rep., vol. 11, no. 1, p. 5556, Dec. 2021, doi: 10.1038/s41598-021-84800-x. [16] D. Vavrik, T. Holy, J. Jakubek, S. Pospisil, Z. Vykydal, and J. Dammer, “DIRECT THICKNESS CALIBRATION: WAY TO RADIOGRAPHIC STUDY OF SOFT TISSUES,” in Astroparticle, Particle and Space Physics, Detectors and Medical Physics Applications, Apr. 2006, pp. 773–778, doi: 10.1142/9789812773678_0122. By Signe Brinch and Philip HansenBispebjerg and Frederiksberg Hospital, Copenhagen, Denmark Over the last decade, weight bearing CT (WBCT) of the lower extremity has been gaining momentum in evaluation of the foot/ankle and knee - see the figure for the number of WBCT publications across all topics over the years from 2001 to 2021. A growing number of international studies have been investigating the use WBCT in different clinical scenarios, which is promising for improving our understanding of functional anatomy and biomechanics during simulated natural loading of the lower extremity.
Pholpat Durongbhan, PhD Candidate |
|||||||||||||

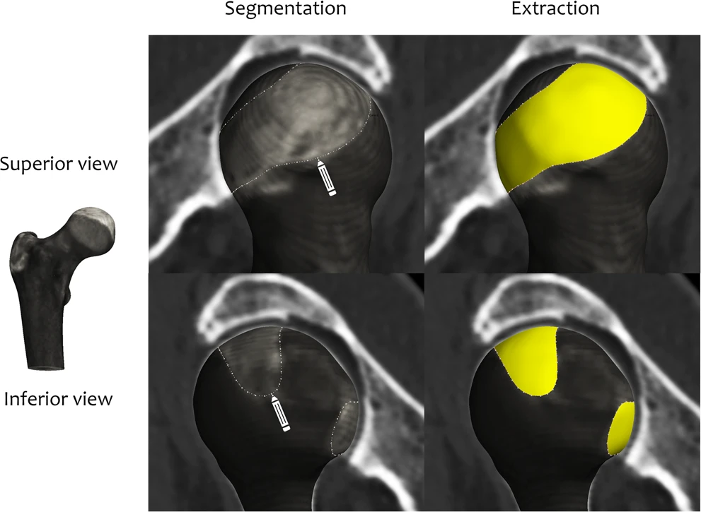 | Figure 2 Joint space patch definition at the hip as the perimeter of the joint space using standard clinical CT imaging[4]. The ‘shadow’ of the acetabulum is projected back onto the femoral head for segmentation and then extraction (yellow). |
But in order to do this, the margins of the joint space need to be defined. Figure 2 summarises how this is achieved at the hip joint, taking the ‘shadow’ of opposing acetabular bone projected back onto the surface of the femoral head and manually segmenting this out for extraction as the ‘joint space patch’.
These steps, along with the joint space measurement algorithm, are performed using the free-to-download software package StradView, developed by Dr Graham Treece and colleagues at the Cambridge University Engineering Department[5]. The joint space patch then acts as a 3-D framework for the joint space mapping algorithm in which the distance between bony surfaces is measured from the imaging data volume and mapped out vertex by vertex (Figure 3).
These steps, along with the joint space measurement algorithm, are performed using the free-to-download software package StradView, developed by Dr Graham Treece and colleagues at the Cambridge University Engineering Department[5]. The joint space patch then acts as a 3-D framework for the joint space mapping algorithm in which the distance between bony surfaces is measured from the imaging data volume and mapped out vertex by vertex (Figure 3).
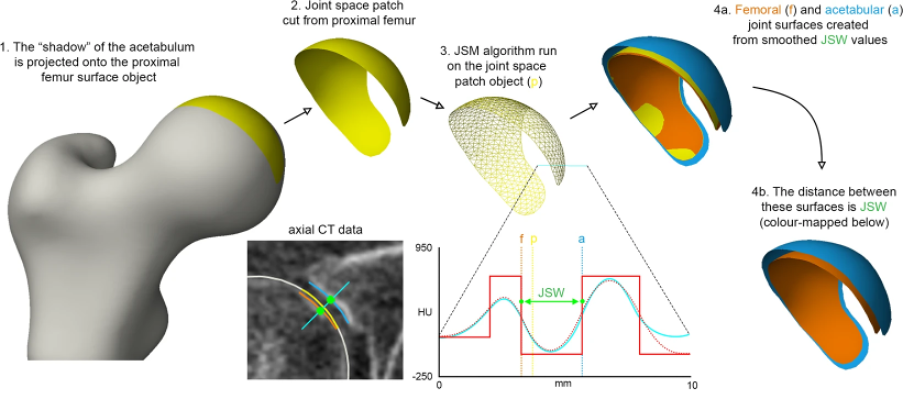
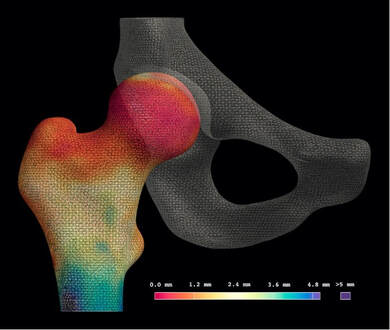
Figure 3 The algorithm for joint space mapping (JSM) at the hip, with joint space width (JSW) defined as the distance between the acetabular (blue) and femoral (orange) articular bone surfaces in 3-D as measured from the original joint space patch (yellow)[6].
Application of joint space mapping at the hip in collaboration with the Icelandic Heart Association and AGES-Reykjavik cohort showed that embracing a 3-D CT-based approach to joint space width assessment (including 3-D morphological parameters and Kellgren & Lawrence grade derived from the same CT imaging) led to an 18% improvement in prediction of future total hip replacement over the FDA gold standard of 2-D minimum JSW measurement[7].
In contrast to these hip studies that used supine imaging, an important technical development over the last decade has been the ability to acquire CT imaging at weight bearing lower limb joints with cone beam technology. The orthopaedic foot and ankle community have been early adopters of this, with joint space mapping having now also been demonstrated at the weight bearing ankle[8]. However, it is only relatively recently that weight bearing CT has been gaining popularity at the knee (see the feature by Neil Segal on this page as an exemplar of this pioneering work).
In collaboration with Professor Segal from Kansas, USA, joint space mapping has now also been applied at the knee (Figure 4) to show its reproducibility, test-retest sensitivity, and relationship with radiographic grading[9].
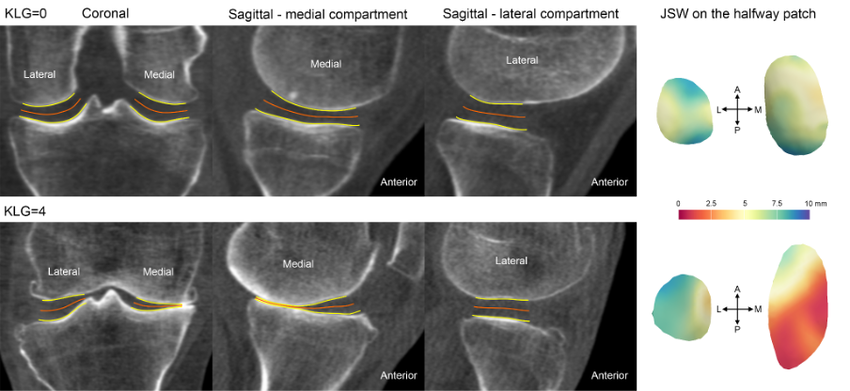
Figure 4 Joint space mapping at the knee using weight bearing cone beam CT technology in two individuals, one with a Kellgren and Lawrence grade (KLG) of 0 (no osteoarthritis) and another with 4 (severe osteoarthritis).The yellow lines represent the bony articular surfaces within the limits of the joint space perimeter, while the orange lines represent the ‘skeleton’ of the joint at the halfway point, on which the colour wash joint space maps are displayed.
The main perceived advantage of a 3-D joint space mapping approach over radiographic joint space measurement is the potential for greater sensitivity in phenotyping and detecting structural disease progression. However the concurrent and predictive validity of this does now need to be tested in a cohort with relevant clinical outcome measures, as is underway in collaboration with the Multicenter Osteoarthritis Study[10].
In addition, joint space maps from the same (or different) individuals can be easily compared by registration to a ‘canonical’ surface, which can then not only be used to look at differences between time points and study groups, but also to perform relevant statistical analysis with statistical parametric mapping. This registration process is performed using free-to-download software developed by Dr. Andrew Gee at the Cambridge University Engineering Department[11]. Statistical parametric mapping can be performed using the SurfStat toolbox for MATLAB[12].
The robustness and versatility of a 3-D surface-based approach to assessment of structural joint disease has also been translated to magnetic resonance imaging (MRI). Cartilage surface mapping, recently developed and tested by MacKay and colleagues from Cambridge and Norwich, UK, has delivered a platform for multiparametric analysis of MRI data at the knee in prize-winning research recognised by the International Society of Magnetic Resonance Medicine (Figure 5)[13].
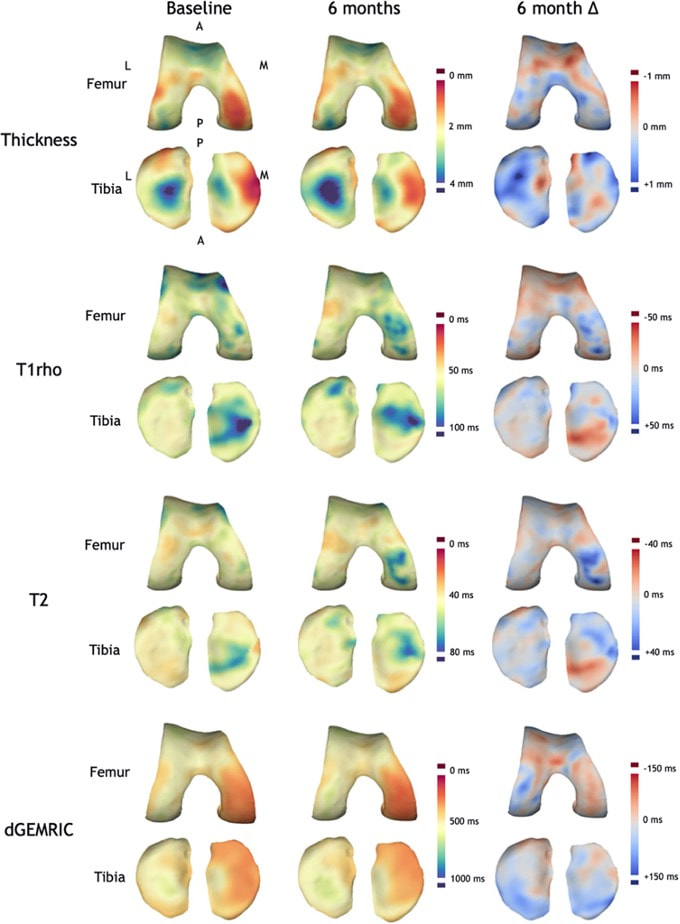
Figure 5 Baseline and 6-month follow-up thickness and relaxation time data for a single OA participant displayed on canonical femoral and tibial surfaces (dGEMRIC = delayed gadolinium enhanced MRI of cartilage). Note the spatial heterogeneity of changes and the co-occurrence of both significant positive and negative changes in thickness and T1rho/T2 relaxation times[14].
If you are interested in finding out more or using any of these 3-D imaging analysis techniques, then please contact Dr. Turmezei through his OCTA profile page[15].
Dr. Tom Turmezei
Consultant Radiologist, Norfolk and Norwich University Hospital, UK
Honorary Associate Professor, University of East Anglia, UK
Twitter handles: @3DJointSpace | @tomturmezei
Consultant Radiologist, Norfolk and Norwich University Hospital, UK
Honorary Associate Professor, University of East Anglia, UK
Twitter handles: @3DJointSpace | @tomturmezei
The figure presents a visualization of calcified cartilage thickness in micro-computed tomography of rabbit patella. Calcified cartilage is segmented with a deep learning model consisting of ResNet-18 with FPN. Please see further details in https://doi.org/10.1111/joa.13435
Looking for PhD project at the juncture of arthritis and imaging? See these unique opportunities to work with the Integrative Cartilage Research Group, headed by Associate Professor Kathryn Stok at the Department of Biomedical Engineering, The University of Melbourne, and Assistant Professor Andy Kin On Wong in the School Public Health at the University of Toronto on projects focused on data & image analysis as well as time-lapsed imaging of arthritis progression.
|
| ||||
Neil Segal, MD, MS
Dr. George Varghese Professor of Rehabilitation Medicine
Director of Clinical Research
Medical Director of Musculoskeletal Rehabilitation
Department of Rehabilitation Medicine
University of Kansas Medical Center
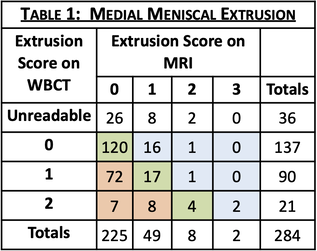
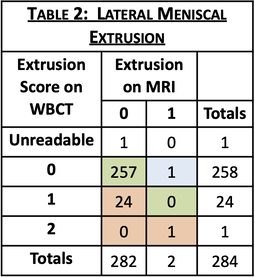
INTRODUCTION: Meniscal extrusion may be missed on non-weight-bearing MRI. Failure to detect meniscal extrusion has hampered development of effective therapies for osteoarthritis (OA) prevention. Weight-Bearing CT (WBCT) has been found to be more sensitive and accurate for other knee OA features, and more accurate assessment of meniscal damage could potentially improve prediction of worsening joint structure and pain.
OBJECTIVE: To assess the rate of detection and severity of meniscal extrusions visualized on WBCT vs. on MRI in older adults with or at elevated risk for knee OA.
METHODS: Ancillary to the Multicenter Osteoarthritis Study (MOST), a longitudinal study of knee OA in older Americans, fixed-flexion knee images were acquired using a prototype WBCT scanner. A 3D dataset with an isotropic resolution of 0.37mm was reconstructed from cone beam projections. MRI was acquired using a 1.5T peripheral scanner with participants seated and the knee semi-flexed. Radiologists, blinded to patient identifiers, scored meniscal extrusion severity on each modality (0/1/2/3). Kellgren-Lawrence (KL) grade of knee OA was collected as part of MOST.
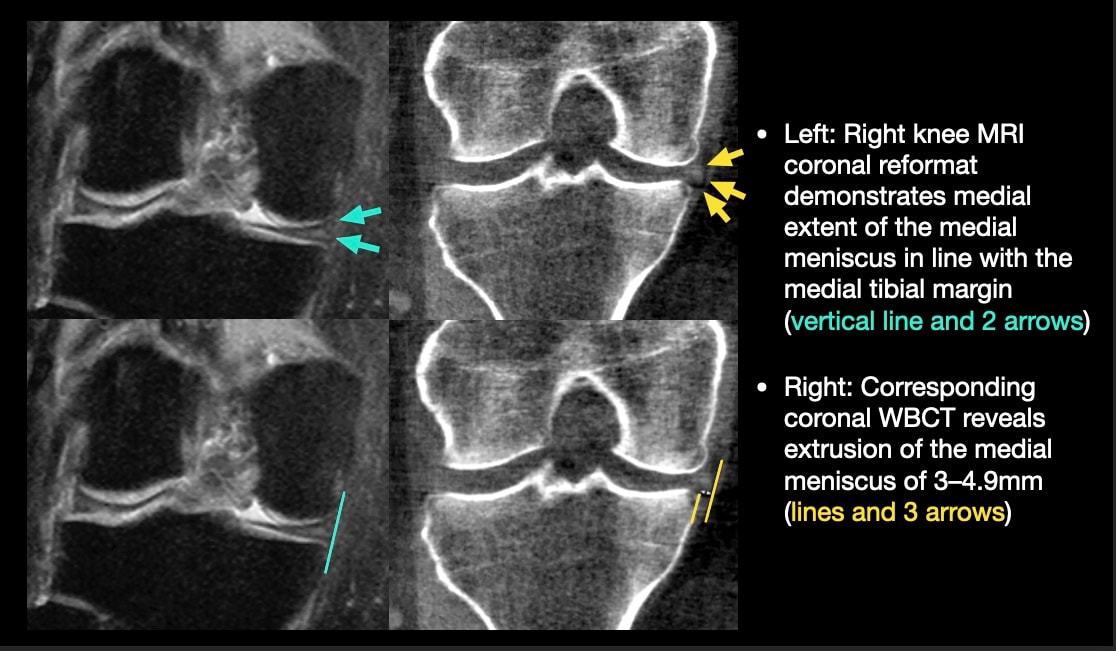
RESULTS: Of 864 participants with WBCT imaging of the knees, 284 had MRI read for meniscal extrusion. WBCT detected extrusion not detected on MRI in 27.1% of medial and 8.5% of lateral menisci and higher grades of extrusion for 30.6% of medial and 8.8% of lateral menisci (full results in Tables 1 & 2). Knees with greater medial and lateral extrusions visualized on WBCT were predominantly those with early OA (KL<2 for 80.5% and 64% respectively). An example case in which meniscal extrusion visualization differed between modalities is included in Figure 1.
Dr. George Varghese Professor of Rehabilitation Medicine
Director of Clinical Research
Medical Director of Musculoskeletal Rehabilitation
Department of Rehabilitation Medicine
University of Kansas Medical Center
INTRODUCTION: Meniscal extrusion may be missed on non-weight-bearing MRI. Failure to detect meniscal extrusion has hampered development of effective therapies for osteoarthritis (OA) prevention. Weight-Bearing CT (WBCT) has been found to be more sensitive and accurate for other knee OA features, and more accurate assessment of meniscal damage could potentially improve prediction of worsening joint structure and pain.
OBJECTIVE: To assess the rate of detection and severity of meniscal extrusions visualized on WBCT vs. on MRI in older adults with or at elevated risk for knee OA.
METHODS: Ancillary to the Multicenter Osteoarthritis Study (MOST), a longitudinal study of knee OA in older Americans, fixed-flexion knee images were acquired using a prototype WBCT scanner. A 3D dataset with an isotropic resolution of 0.37mm was reconstructed from cone beam projections. MRI was acquired using a 1.5T peripheral scanner with participants seated and the knee semi-flexed. Radiologists, blinded to patient identifiers, scored meniscal extrusion severity on each modality (0/1/2/3). Kellgren-Lawrence (KL) grade of knee OA was collected as part of MOST.
RESULTS: Of 864 participants with WBCT imaging of the knees, 284 had MRI read for meniscal extrusion. WBCT detected extrusion not detected on MRI in 27.1% of medial and 8.5% of lateral menisci and higher grades of extrusion for 30.6% of medial and 8.8% of lateral menisci (full results in Tables 1 & 2). Knees with greater medial and lateral extrusions visualized on WBCT were predominantly those with early OA (KL<2 for 80.5% and 64% respectively). An example case in which meniscal extrusion visualization differed between modalities is included in Figure 1.
CONCLUSION: WBCT detects meniscal extrusions not detected on standard MRI. Detection of this risk factor for OA progression people with early disease supports a need to assess longitudinal associations between meniscal extrusion detected on WBCT and worsening of pain and joint structure.
SPONSOR: NIH-NIAMS R01 AR071648, NIH-NIA U01 AG018832, U01 AG19069
SPONSOR: NIH-NIAMS R01 AR071648, NIH-NIA U01 AG018832, U01 AG19069
Figure 1
Andy Kin On Wong, PhD
Scientist, Joint Department of Medical Imaging, UHN
Assistant Professor, Epidemiology, DLSPH, University of Toronto
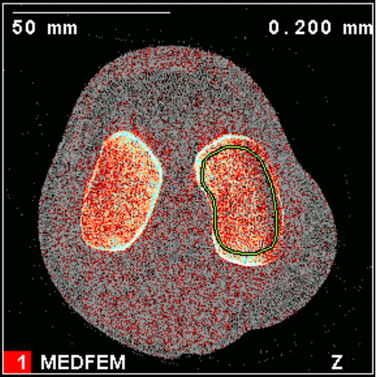
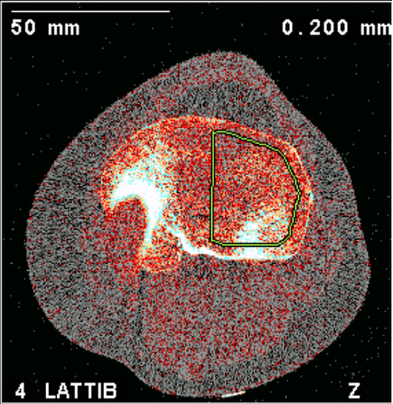
Peripheral quantitative computed tomography (pQCT) has been used to measure subchondral BMD of the knee.
Although pQCT model XCT2000 has a limited gantry diameter, it can still accommodate most individuals with BMI≤ 30 kg/m2. XCT3000 has a larger gantry able to accommodate most knees even for individuals with higher BMI.
Bennell previously examined subchondral BMD at the 2% and 4% tibial plateau relative to a reference line placed at a level between medial and lateral tibial compartments’ most radio-opaque plateau regions. No femoral condyles were examined, and if compartments were misaligned from the scanner’s Z-axis, the compartment-specific analyses would be oblique.
https://onlinelibrary.wiley.com/doi/pdf/10.1002/art.23795
Whyte presented alternative protocols suggesting 4 individual reference lines for each of medial and lateral tibial and femoral condyles, then using 1% relative distance for tibial plateaus and 2% relative distance for femoral condyles – to account for differences in regions of interests.
- Tibial plateau 1% region avoiding the cortex in most cases.
- Femoral condyle 2% region avoiding the cortex and permitting a substantial amount of trabecular bone for analysis.
| Rachel Whyte Comparison of pQCT Subchondral Bone Imaging Protocols.pdf |
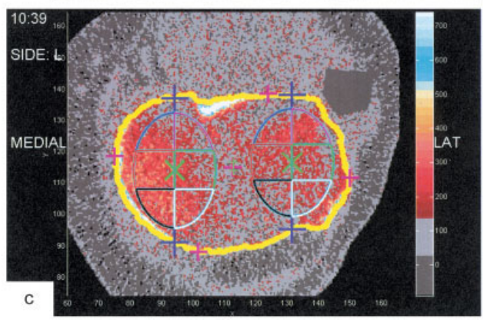
Subchondral regions of interests marked by periosteal perimeters inset by 20% and total BMD computed to yield subchondral BMD for each compartment.
 |  |
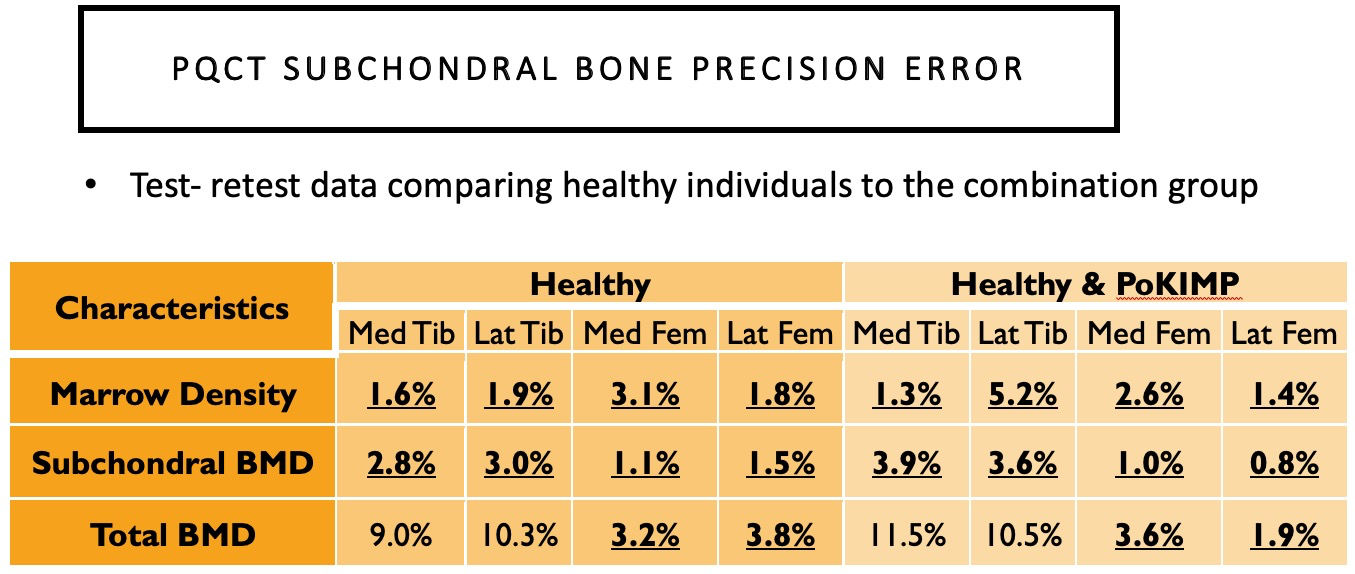
The results of test-retest precision for Protocol 3 applied to healthy and diseased patients, demonstrating sufficient test-retest precision for subchondral BMD measurements overall:
Archives
May 2024
December 2022
March 2022
October 2021
August 2021
July 2021
June 2021
January 2021
 RSS Feed